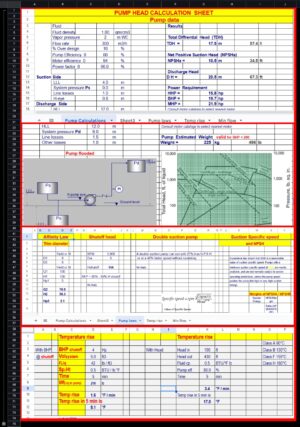
A pump’s published performance curve tells you what it can deliver — but what it actually delivers once installed depends on where that curve intersects your system’s resistance curve. Many “pump doesn’t perform as expected” complaints trace back to this intersection never being checked. The Pump System Curve Excel Sheet from GrowMechanical builds the system curve and finds the operating point against your selected pump’s curve.
It is built for mechanical and process engineers verifying that a selected pump will actually operate at the flow and head the project needs, not just its rated capacity.
What This Sheet Calculates
- System resistance curve: static head + friction losses at multiple flow rates
- Friction loss scaling with flow (approximately proportional to flow squared)
- Intersection point between the system curve and pump performance curve
- Actual predicted operating flow and head
- Comparison against the pump’s best efficiency point (BEP)
Why the Operating Point Matters
- Confirms Real Performance: The pump’s rated flow and head only apply at its own curve — your system curve determines where it actually operates.
- Flags Efficiency Problems: An operating point far from the pump’s BEP means reduced efficiency, higher vibration risk, and shorter bearing/seal life.
- Catches Selection Mistakes: A pump that looks adequate on paper can be significantly over- or under-sized once the actual system curve is applied.
Key Features
- System curve construction from static head and friction loss inputs
- Operating point calculation from system curve × pump curve intersection
- Comparison against the pump’s best efficiency point
- Fully editable formulas — no hidden cells
- Works offline in Microsoft Excel
Technical Specifications
| Parameter |
Details |
| File Format |
Microsoft Excel (.xlsx) |
| System Curve Basis |
Static head + friction losses (approximately Q² relationship) |
| Key Output |
Operating point (flow and head) at curve intersection |
| Additional Check |
Operating point vs. pump best efficiency point (BEP) |
| Editable |
Yes — all formulas open for review |
| Internet Required |
No — works fully offline |
Typical Applications
- Confirming actual pump performance after installation or system changes
- Troubleshooting pumps that don’t deliver expected flow
- Verifying pump selection against a piping system with changing friction losses
- Evaluating operating point shift after a system modification (added equipment, pipe changes)
Who Should Use This Sheet
- Mechanical and process engineers verifying pump selection
- Plant engineers troubleshooting underperforming pumps
- EPC engineers cross-checking vendor pump proposals against system data
- Engineering students learning pump-system curve interaction
What You’ll Receive
- Editable Excel sheet with system curve and operating point calculations
- Comparison against pump best efficiency point
- Lifetime access with a single, one-time purchase
Compatibility
- Microsoft Excel 2010 or later (Windows or Mac)
- No macros or add-ins required
- Works fully offline once downloaded
How to Use This Sheet
- Enter static head and pipe/fitting friction loss data at several flow rates.
- Enter your selected pump’s performance curve data (flow vs. head).
- Review the calculated system curve and the operating point where it intersects the pump curve.
- Compare the operating point against the pump’s best efficiency point.
- Reassess pump selection if the operating point is far from BEP or doesn’t meet your required duty.
For complete pump sizing, see our Centrifugal Pump Design & Selection Excel Tool and Centrifugal Pump Design Excel Sheet. Check suction margin with our NPSHA Calculation Excel Sheet. Explore the Engineering Design & Calculation Master Excel Bundle, or browse the complete product catalog.
Frequently Asked Questions
Why does my pump not deliver its rated flow after installation?
The pump’s rated flow assumes a specific head. If your actual system curve intersects the pump curve at a different point, the real delivered flow and head will differ from the catalog rating — this sheet identifies that actual point.
What is the best efficiency point (BEP), and why does it matter?
BEP is the flow at which a pump operates most efficiently with the least vibration and wear. Running consistently far from BEP reduces efficiency and can shorten bearing and seal life.
How does friction loss scale with flow rate?
Friction losses in piping systems increase approximately with the square of flow rate, which is why the system curve rises steeply at higher flows — this sheet applies that relationship when building your curve.
Can this sheet help troubleshoot an existing underperforming pump?
Yes. Comparing the actual system curve to the installed pump’s curve often reveals why a pump is delivering less flow than expected — commonly due to higher-than-designed system friction losses.
Does this replace a full pump vendor selection process?
No. This sheet verifies the operating point for a pump you’ve already selected or are evaluating; use it alongside, not instead of, vendor pump curve data.
Not sure where your pump will actually operate? Get the Pump System Curve Excel Sheet today and find the real operating point before performance problems show up in the field.