Process Design Engineering Services: PFD, P&ID, Hydraulic Calculations and Process Optimization
Document No. GML-BLOG-2026-001Revision 0ASME · API · TEMA · ISO

A process plant is defined long before the first item of steel arrives on site. It is defined in the process design. Every downstream discipline – mechanical, piping, instrumentation, electrical, civil – takes its input from documents produced during this phase. If the process design is sound, the rest of the project has a fighting chance. If it is not, every discipline inherits the same error and multiplies it.
This is not a theoretical concern. A line sized fifty millimetres too small becomes a permanent throughput ceiling that no amount of operational effort can lift. A control valve given only 0.2 bar of pressure drop will hunt at every load change for the next twenty years. A design basis that omits the maximum summer ambient temperature produces a cooling system that works beautifully for nine months of the year. These are process design decisions, and they are almost never economically reversible once the plant is built.
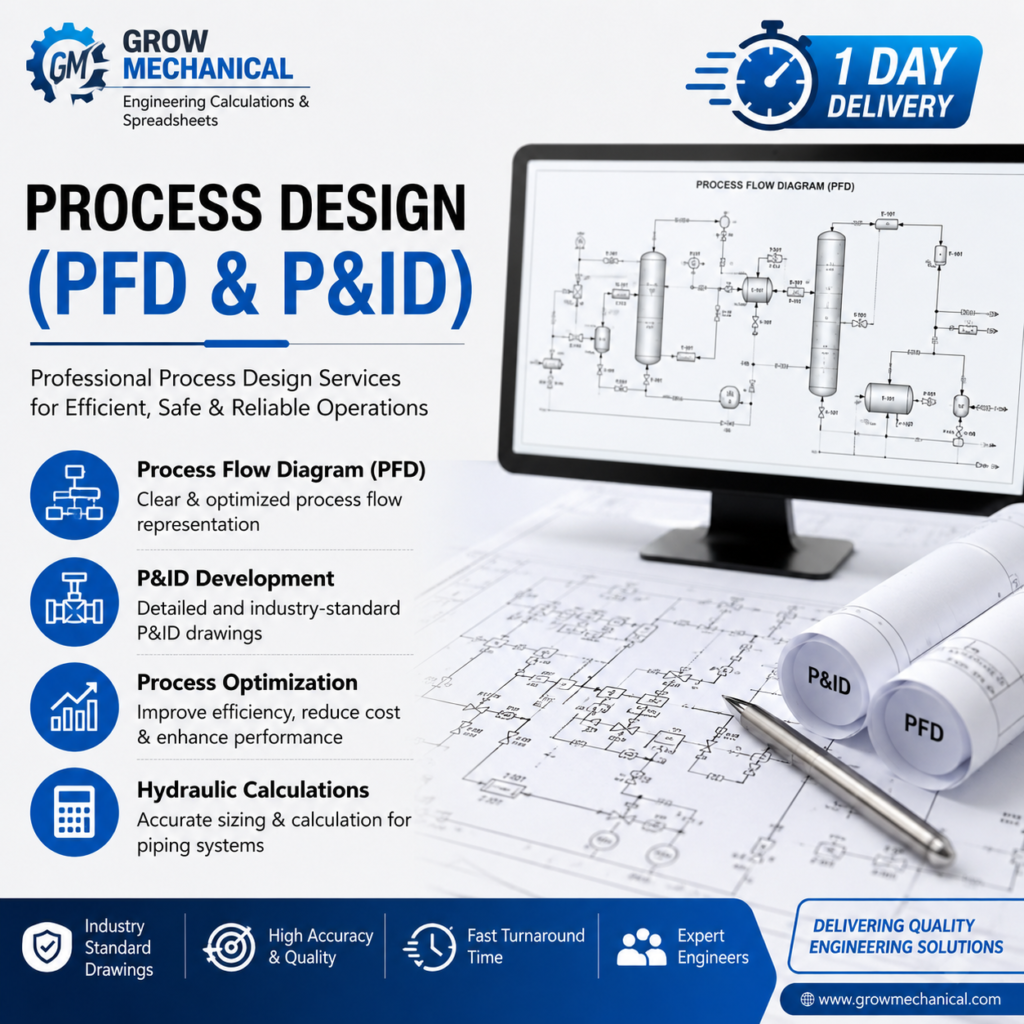
What Is Process Design Engineering?
Process design engineering is the discipline that converts a commercial objective – produce X tonnes per annum of product Y at specification Z – into a defined, quantified and documented technical scheme. It answers the questions that everything else depends upon: what unit operations are needed, in what sequence, at what temperature and pressure, with what flow rates, using which utilities, and controlled in what manner.
The output is not a drawing. The output is a coherent set of engineering documents in which every number can be traced back to a stated assumption and a calculation. The drawings are simply the most visible part of that set.
Core Process Design Deliverables
- Basis of Design (BOD) – capacity, turndown, feed and product specifications, battery limit conditions, utility conditions, site ambient data, design margins, design life and applicable codes.
- Material and Energy Balance – stream-by-stream mass closure, component splits, heat duties and a consolidated utility consumption summary.
- Process Flow Diagram (PFD) – major equipment, principal streams, stream numbering and a stream table listing flow, temperature, pressure, density, viscosity and phase.
- Piping and Instrumentation Diagram (P&ID) – every line with line number, size, material class and insulation code, plus every valve, instrument, interlock, relief device, vent, drain, sample point and utility tie-in.
- Line list and equipment list – the tabular backbone that feeds piping material take-off and mechanical design.
- Hydraulic calculations – line sizing, pressure drop, pump and compressor differential head, control valve pressure drop allocation, gravity and two-phase line checks.
- Control philosophy and cause and effect matrix – normal control, alarm settings, trip settings, interlock logic and the defined safe state for each scenario.
- Relief and blowdown philosophy – identification of overpressure scenarios and the governing case for each relief device.
- Utility summary and tie-in schedule – the interface document between the new unit and the existing plant.
PFD Versus P&ID: The Difference That Matters
| Aspect | Process Flow Diagram (PFD) | Piping & Instrumentation Diagram (P&ID) |
|---|---|---|
| Purpose | Communicates the process concept | Communicates the construction and operating detail |
| Equipment shown | Major equipment only | All equipment including spares and packages |
| Lines shown | Main process streams | Every line, utility, vent, drain and relief |
| Instrumentation | Key control loops only | Every instrument with full tag number |
| Data | Stream table with conditions | Line numbers, sizes, material class, insulation |
| Primary users | Management, licensors, cost estimators | Procurement, construction, commissioning, operations, HAZOP |
| Revision frequency | Low after design freeze | High throughout project life, including as-built |
The P&ID is the single most-referenced document across the life of a plant. It is used to buy valves, to install lines, to write loop check sheets, to write standard operating procedures, and to conduct the HAZOP. When a P&ID is internally inconsistent with the PFD, that inconsistency is silently copied into all of those downstream activities.
How a Process Design Is Actually Built
- Fix and freeze the design basis. Every subsequent change costs a multiple of what it would have cost here.
- Close the mass balance before touching energy. An unclosed balance is almost always hiding a missing stream or an unrecognised recycle.
- Develop the energy balance and identify heat integration opportunities while the layout is still fluid.
- Produce the PFD with a complete stream table. Every stream should have flow, temperature, pressure, density, viscosity and phase.
- Size equipment preliminarily to establish duties, driver ratings and long-lead item identification.
- Size lines on both velocity and pressure drop. Neither criterion alone is sufficient.
- Allocate control valve pressure drop deliberately before finalising pump head.
- Develop the P&ID with line numbers, instrument tags, relief devices and utility connections.
- Verify every overpressure scenario and document the governing relief case.
- Issue for HAZOP, incorporate recommendations, and reissue for design.
- Support vendor selection, incorporate as-purchased data, and reissue for construction.
Line Sizing and Hydraulic Calculation
Line sizing is where process design either creates or removes operating cost. An oversized line wastes capital permanently; an undersized line wastes energy permanently. The following velocity ranges are used as the starting point, with pressure drop then checked as the governing criterion for long runs.
| Service | Recommended velocity | Controlling consideration |
|---|---|---|
| Pump suction (liquid) | 0.6 – 1.5 m/s | Protect NPSH available |
| Pump discharge (liquid) | 1.5 – 3.0 m/s | Pressure drop economics |
| Gravity and drain lines | 0.3 – 1.0 m/s | Self-venting and slope |
| Saturated steam | 25 – 40 m/s | Erosion and noise |
| Superheated steam | 35 – 60 m/s | Noise limit |
| Compressed air and gas | 10 – 20 m/s | Density-velocity squared limit |
| Two-phase lines | Per rho-v-squared criterion | Slug flow and erosion |
Worked Example: Line Size and Pressure Drop Verification
Given a flow of 120 cubic metres per hour of water at 25 degrees Celsius, in DN 150 Schedule 40 pipe with an internal diameter of 154.1 mm, over an equivalent length of 180 metres, with a Darcy friction factor of 0.019:
Calculation
Q = 120 m3/h = 0.03333 m3/s
A = (pi / 4) x 0.1541^2 = 0.01865 m2
v = 0.03333 / 0.01865 = 1.79 m/s      (within 1.5 - 3.0 m/s range - acceptable)

Delta-P = f x (L / D) x (rho x v^2 / 2)
        = 0.019 x (180 / 0.1541) x (1000 x 1.79^2 / 2)
        = 0.019 x 1168 x 1602
        = 35,550 Pa = 0.36 bar
Reducing the line to DN 125 would raise velocity to approximately 2.7 m/s and roughly double the friction loss. That trade-off is defensible on a short run and indefensible on a long one. This is exactly the calculation that gets skipped when line sizes are copied from a similar previous project.
Control Valve Pressure Drop Allocation
A control valve can only control what it is given authority over. Common industry practice is to allocate the greater of 25 to 35 per cent of the dynamic system pressure loss, or a minimum of approximately 0.7 bar, across the control valve at design flow. Allocate less and the valve loses authority as flow increases, producing sluggish response at high load and instability at low load. Allocate more and the pump consumes energy permanently to overcome a deliberate restriction.
This allocation must be made before the pump differential head is finalised, because the valve drop is part of that head. Attempting to correct it afterwards means either re-purchasing the pump or living with a permanently throttled system.
Process Optimization and Debottlenecking
Optimization work on an existing plant follows a different logic to greenfield design. The objective is to find the actual constraint rather than the assumed one. In practice, the assumed bottleneck and the real bottleneck differ in a substantial proportion of cases.
- Build a hydraulic model of the existing system from as-built isometrics and verified field data, not from the original design documents.
- Measure rather than assume – pressure survey across the network under actual operating conditions.
- Quantify each element’s contribution to total system loss and rank them.
- Check whether existing equipment has spare capability within casing, motor and structural limits before assuming replacement.
- Evaluate partial solutions – a parallel loop on a restricted section often achieves the same result as full replacement at a fraction of the cost and shutdown duration.
- Verify turndown at the new operating point. Debottlenecking frequently creates a low-load stability problem that nobody checked.
Applicable Standards and Codes
| Code / Standard | Application in process design |
|---|---|
| ASME B31.3 | Process piping design, allowable stress and flexibility |
| API 520 / API 521 | Pressure relief device sizing and overpressure scenario definition |
| API 610 | Centrifugal pump requirements referenced during hydraulic design |
| ISA 5.1 | Instrumentation symbols and identification on P&IDs |
| IEC 60079 | Hazardous area classification where flammables are present |
| NFPA 30 | Flammable and combustible liquids handling requirements |
| ISO 10628 | Diagrams for the chemical and petrochemical industry |
| OSHA 29 CFR 1910.119 | Process safety information requirements |
Common Process Design Mistakes and Their Consequences
| Mistake | Consequence on the operating plant | Preventive action |
|---|---|---|
| Design basis never frozen | Continuous rework, schedule slip, cost growth | Formal BOD sign-off before calculation begins |
| Margins stacked at multiple stages | Oversized pumps running left of BEP, chronic seal failure | Apply margin once, deliberately, and document it |
| Line sized on velocity only | Excessive pressure drop on long runs | Always check both velocity and pressure drop |
| Control valve drop not allocated | Valve hunting, poor turndown, no authority | Allocate 25-35 per cent of dynamic loss before pump selection |
| Relief scenarios reviewed late | HAZOP actions requiring P&ID rework after issue | Complete API 521 scenario review before HAZOP issue |
| Utility conditions assumed | Undersized utility headers discovered at commissioning | Verify actual header pressures and temperatures on site |
| No turndown verification | Instability and off-spec product at low load | Check every control loop at minimum design throughput |
| P&ID not updated as-built | Latent safety hazard and commissioning error source | Formal red-line incorporation after construction |
Best Practices That Separate Good Process Design From Adequate Process Design
- Document every assumption in the design basis, including the ones that seem obvious. The obvious assumption is the one that turns out to be wrong.
- Check the design at the extremes of the operating envelope – maximum summer ambient, minimum winter ambient, start-of-run and end-of-run fouling, maximum and minimum turndown – not only at the normal case.
- Keep the stream table and the mass balance as a single source of truth. When they diverge, the P&ID inherits the error.
- Number lines and instruments systematically from the beginning. Retrofitting a numbering system across an issued P&ID set is a week nobody budgeted for.
- Involve operations and maintenance input at the P&ID stage, when changes are still cheap.
- Independently check every hydraulic calculation. A second engineer finds errors that the originator cannot see.
Industries Served
Process design services are delivered across chemical and specialty chemical plants, oil and gas processing facilities, petrochemical complexes, pharmaceutical manufacturing, fertilizer plants, food and beverage processing, water and wastewater treatment including effluent treatment and zero liquid discharge schemes, power generation auxiliaries, steel and metals gas cleaning and cooling circuits, pulp and paper, and general manufacturing utility systems.
Frequently Asked Questions
Q1. What is the difference between a PFD and a P&ID?
A PFD shows major equipment, principal streams and stream conditions – the process concept. A P&ID shows every line, valve, instrument, interlock and utility connection with full tag numbers – the construction and operation reference.
Q2. What input data is required to start a process design?
Capacity and turndown, feed and product specifications, battery limit conditions, utility availability and conditions, site ambient data, applicable client specifications and codes, and any existing drawings. Missing data is documented as an assumption in the Basis of Design for your approval rather than silently filled in.
Q3. How are line sizes determined?
By checking velocity against service-specific ranges and then verifying pressure drop over the actual equivalent length. Long runs are usually governed by pressure drop, short runs by velocity.
Q4. How much pressure drop should a control valve be given?
Typically the greater of 25 to 35 per cent of the dynamic system loss or approximately 0.7 bar at design flow, so the valve retains authority across the operating range.
Q5. Can you review and verify an existing process design?
Yes. Independent design verification is frequently requested before an investment decision, a HAZOP session, or a third-party review. The review covers mass balance closure, hydraulic consistency, relief adequacy and P&ID completeness.
Q6. Do you support HAZOP studies?
Yes. P&IDs are issued in a state fit for study, and HAZOP recommendations are tracked through to documented closure on the reissued drawings.
Q7. What is a design basis and why does it need sign-off?
It is the document that records every assumption, condition and margin the design rests on. Sign-off matters because every calculation downstream is only valid against the basis that produced it.
Q8. Can process design be delivered for a brownfield revamp?
Yes, though brownfield work begins with data and as-built verification, because the drawings and the physical plant rarely agree. Tie-in identification and constructability review form part of the scope.
Q9. What software and methods are used?
Hydraulic and thermal calculations are performed using transparent, code-referenced calculation sheets with visible formulas, supported by drafting in AutoCAD. Every calculation is traceable rather than produced by a black-box output.
Q10. How long does a process design package take?
A standalone hydraulic verification or line sizing package is typically a matter of days. A full process design package depends on scope and data availability and is scheduled after the design basis is agreed.
Key Takeaways
- Process design fixes the ceiling on what the plant can ever achieve. Downstream disciplines can only work within it.
- The P&ID is the most reused document in the plant’s life; errors there propagate into procurement, construction, commissioning and operations.
- Line sizing must satisfy both velocity and pressure drop criteria.
- Control valve pressure drop must be allocated before pump head is finalised.
- Margins should be applied once and documented, never stacked at successive stages.
- Every design should be checked at the extremes of its operating envelope, not only at the normal case.
Conclusion
Process design is the discipline of making decisions that remain defensible three years later, when the plant is operating at conditions nobody in the design meeting predicted. That demands stated assumptions, visible calculations, cited code clauses, and an engineer who has seen what happens when a design meets an operating floor.

