Characteristics of positive displacement pump
The positive displacement pump gives approx. a constant flow at a wide range of pressures. Mostly positive displacement pump use for deliver high viscosity fluid. This type of pump is three types rotary, reciprocating and linear. This type of pump operates at the initial stage with always turn the valve in open condition because It has not shut off the head and continues to discharge the liquids, the cause of leakage in discharge line.
Pressure vs flow rate chart
Now in figures you can see centrifugal pumps flow rate is varying with respect to pressure where, as in the positive displacement pump more or less constant flow regardless of pressure as showing line showing in the graph.
 |
Pressure vs flow rate chart |
Viscosity vs flow rate graph
Page navigation
You can see in the flow rate vs viscosity graph loss of flow as the viscosity goes up in centrifugal but the positive displacement pump’s flow actually increases. This is because the higher the viscosity liquids fill the clearances of the pump cylinder body more as compared to other causing pump and give higher volumetric efficiency.
Net Positive Suction Head Requirements
In centrifugal pump, the NPSHR varies respect of flow which is determined by pressure and viscosity as discussed above. In a PD pump NPSHR varies as a function of flow which is determined by speed. The lower the speed of a PD pump, the lower the NPSHR required.
Characteristics curve of positive displacement pump
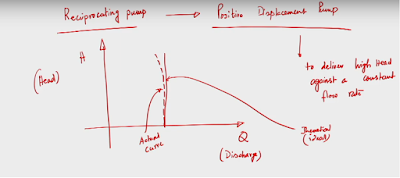
The characteristic curve of (HQ curve) a positive displacement pump showing in figure. H(Head) Q(flow) characteristic curve when positive displacement pumps that we have taken as an example. you know the working principle of reciprocating the pump. because reciprocating pumps is also a category of PD pump rather than Positive Displacement pump. I said that apart from the reciprocating pump there are many other types of pumps like screw pump, vane pump, gear pumps that also you know falls under the category of positive displacement pump. So, here we are discussing the HQ curve of reciprocating pump.
.
 |
Characteristics curve of PD pump |
We have discussed the working principle of reciprocating pump
How does this pump work?
A positive displacement pump, such as a reciprocating pump, operates by sucking fluid from a sump and discharging it into a delivery tank. This process involves a suction stroke and a delivery stroke, which are connected by a crank and connecting rod mechanism. The linear motion of the piston is generated by this mechanism, which depends on the frequency of the crank rotation speed.
Working Principle of Positive Displacement Pump and HQ Curve
To understand the performance of a positive displacement pump, we can analyze the HQ curve. The HQ curve illustrates the relationship between the discharge flow rate (Q) and the head (H) generated by the pump. In this type of pump, the HQ curve typically exhibits a characteristic pattern, as shown in the figure.
Positive displacement pumps are known for their ability to deliver high head against a nearly constant flow rate. This is a distinct feature of this pump class. They excel at delivering high pressure against a consistent speed with an almost constant flow rate. During the discharge process, water is discharged from the open end of the cylinder to the closed end, leading to the development of high pressure. However, due to some amount of leakage through the glands, the actual curve may deviate from the ideal curve.
The performance of a reciprocating pump is highly dependent on the volume captured in the cylinders. Higher or fluctuating speeds in reciprocating pumps can increase the chances of leakage. The slip factor represents the difference between the theoretical discharge and the actual discharge of the pump. Some losses during operation, such as slip and friction losses in mechanical components, affect the slip factor.
As the discharge pressure increases, the head of the fluid also increases due to friction losses, including slip and other mechanical part interactions.
Discharge and speed graph
The discharge and speed graph for a positive displacement pump, such as a reciprocating pump, typically illustrates the relationship between the pump’s discharge flow rate and the operating speed of the pump. Here is a general representation of such a graph:
Let’s examine the graph:
- X-Axis: The X-axis represents the pump speed or rotational speed of the pump. It is usually measured in revolutions per minute (RPM) or radians per second (rad/s). The pump speed indicates how fast the pump is rotating or reciprocating.
- Y-Axis: The Y-axis represents the pump discharge flow rate. It is typically measured in units such as gallons per minute (GPM), liters per second (L/s), or cubic meters per hour (m³/h). The discharge flow rate represents the volume of fluid delivered by the pump per unit of time.
Discharge Flow Rate Curve:
The discharge flow rate curve shows how the pump’s flow rate varies with different operating speeds. As the pump speed increases, the discharge flow rate generally increases, indicating that the pump is delivering more fluid.
It’s important to note that the specific shape and characteristics of the discharge and speed graph can vary depending on the pump design, size, and operating conditions. Different pump types may exhibit different curve shapes. Additionally, factors such as pump efficiency, fluid viscosity, and system resistance can also influence the curve shape and overall pump performance.
Efficiency and head graph
The efficiency and head graph curve for a positive displacement pump, such as a reciprocating pump, typically shows the relationship between the pump’s efficiency and the head (pressure) it can generate at various flow rates. Here is a general representation of such a graph:
Let’s break down the graph:
X-Axis: The X-axis represents the flow rate or the volume flow rate of the pump. It is usually measured in gallons per minute (GPM), liters per second (L/s), or cubic meters per hour (m³/h). The flow rate indicates how much fluid the pump can deliver per unit of time.
Y-Axis: The Y-axis represents the pump head or pressure generated by the pump. It is typically measured in units such as feet (ft), meters (m), or pounds per square inch (psi). The pump head refers to the pressure at which the pump can deliver the fluid.
Efficiency Curve:
The efficiency curve shows the efficiency of the pump at different flow rates. Efficiency is usually expressed as a percentage and represents the ratio of the pump’s output power (actual work done on the fluid) to the input power (power supplied to the pump). The efficiency curve shows how the efficiency of the pump changes with varying flow rates.
Head Curve:
The head curve represents the pressure or head generated by the pump at different flow rates. It shows the relationship between the flow rate and the corresponding pressure or head produced by the pump. As the flow rate increases, the pump’s ability to generate pressure decreases due to internal losses and limitations of the pump design.
It’s important to note that the specific shape and characteristics of the efficiency and head graph curve can vary depending on the pump design, size, and operating conditions. Different pump types, such as reciprocating pumps, centrifugal pumps, or rotary pumps, may exhibit different curve shapes. Additionally, factors such as pump speed, fluid viscosity, and system resistance can also influence the curve shape and overall pump performance.

