Centrifugal Pump Characteristics Curves
Centrifugal pumps are designed to operate at one system condition like fixed speed, flow rate, head and fluid properties. But in actual scenarios pump operation may change or operate at different points and conditions like head and flow rate so performance may also be changed accordingly. So to predict the pump performance at changed conditions required a characteristics curve for the same pump.
For example, if the flow of the pump suction line is less than the designed flow then the output of flow velocity through the impeller will also be changed, and accordingly get changing in head developed by the pump, and finally the efficiency of the pump will be decreased. And to save the pump from an under-performing buyer required a characteristic curve developed by the manufacturer during the performance test at the manufacturer shop.
Generally manufacturers have performed testing in their own manufacturing shop in front of the client or third party inspector bodies (not for all pumps), but this is a requirement of clients. They published different curves and different pumps on the basis of their performance and performance curves are generated by testing many pumps for specific models. The following details should be mentioned in Pump characteristics curves are classified. Then different types of characteristics curves of centrifugal pumps are discussed.
Why Pump Characteristics Curves Required?
Pump characteristics curve will be useful in selecting an appropriate pump for your desired. Characteristic curves of a centrifugal pump are required, because for example each human being has different characters to each other, and the pump which is manufactured by one manufacturer is different from the pump with the same principle, which is manufactured by the other manufacturer. That is why this is very important and useful for everyone.
How to calculate head of centrifugal pump?
Then calculate the head of the centrifugal pump using the discharge and estimate the pump power required to lift the amount of water from a water source. There are three scenarios: one is the water source is below the centerline of the pump, and the second one is above the centerline of the pump. Last one is neutral, like a water source is available at the center of the pump impeller.
Before going to pump characteristic curves we will have to be aware about terminology most frequently used, that is cavitation. This is a common problem in centrifugal pumps, because the cavitation itself indicates the formation of cavities inside the impeller.
How is cavitation formed inside the impeller?
So what happens when the impeller rotates and speed increases, that will increase the fluid temperature.The fluid temperature increases their vapor pressure water particles or the water molecules start to escape from the surface because of vaporization. Vapor vaporized particles, which are accumulated inside the eye of the impeller, are called cavities. when the cavities pass from the low pressure at the eye of the impeller and to high pressure at the end of the impeller. at the end of the vanes, all the bubbles, which are formed at the center of the impeller are going to burst. So, this mechanism or this phenomenon is called cavitation.
What is the implication of that process?
The implication due to cavitation on the impeller edges is that they are going to wear chipping of impeller surfaces wearing of an impeller surface, then completely going to damage the impeller. Basically the cavitation coefficient is defined as (σ) = Hsv/H,
Hsv – Net positive suction head. In the centrifugal pump suction line there is a foot valve, so in order to lift water from this point to the center of the impeller, you need to maintain a minimum suction head. That suction head is required to lift water from one point to another, so the net positive suction head is the minimum pressure or the negative pressure required to lift water from the source in the centrifugal pump, what’s called net positive suction head. And this net positive suction head divided by the total head is the cavitation coefficient.
The cavitation coefficient, which is the critical value at which cavitation will begin, can be determined by testing the pump at constant speed and capacity at varying suction lifts. Maintain the constant speed at varying suction lifts, you can find out at the critical suction lift for which you can lift water and that is the critical value in case of cavitation in centrifugal pumps. The efficiency increases for lower values. The cavitation coefficient is greater than 0.3 then that is the pump is operating successfully.
The safe suction lift should be 4.5 to 5 meters for most of the pumps. The pressures are in the suction point at the eye of the impeller, which is going to decrease, and then increase at the discharge point and create low pressure that is less than the vapor pressure of the fluid, then there is a problem with the cavitation. The cavitation is going to form. In the first case. The low pressure at the eye of an impeller is above the vapor pressure of the water, which means that there is no bubble forming and no cavitation is going to take place.
Net positive suction head
The net positive suction head is the sum of the static and dynamic heads – stagnation head – minus the equilibrium vapor pressure head.
Static head
Static head is defined as the addition of the difference in liquid elevations and surface pressures in tanks.
Dynamic head
The dynamic head is defined as the sum of the head losses in the pipelines, strainer, valves, instruments equipment fittings, and other components installed in the system.
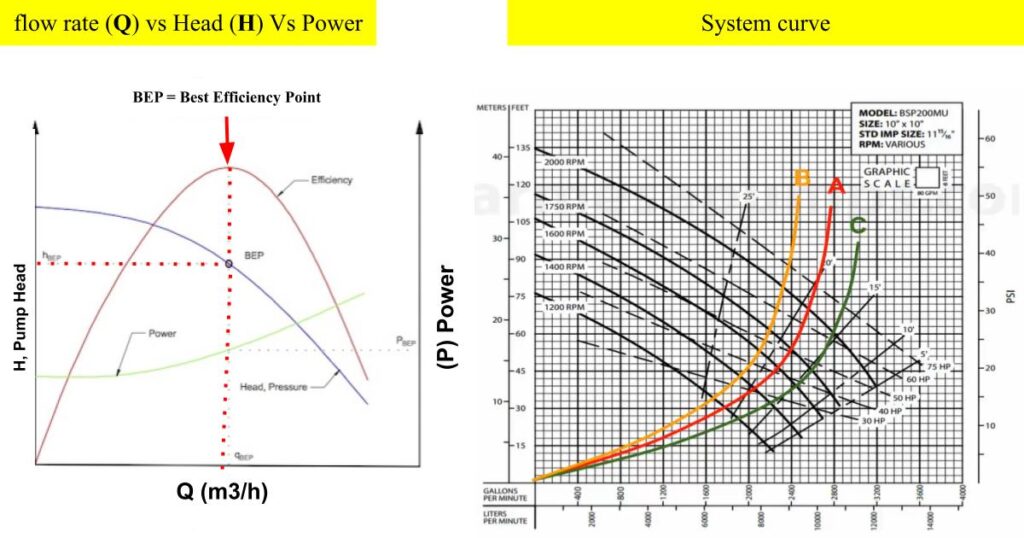
Pump characteristic curves is a graphical representation of the behavior of that particular pump, in which it is represented quantity of flow vs head develop (Discharge (Q) on X axis and head on Y axis), flow rate vs power, power taken vs efficiency (Power BHP on y axis and efficiency curves on axis), the 3 characteristic curves of a particular pump described as below.
- Q Vs H (Flow rate vs head)
- Q Vs P (Flow rate vs power)
- P Vs efficiency (power taken vs efficiency)

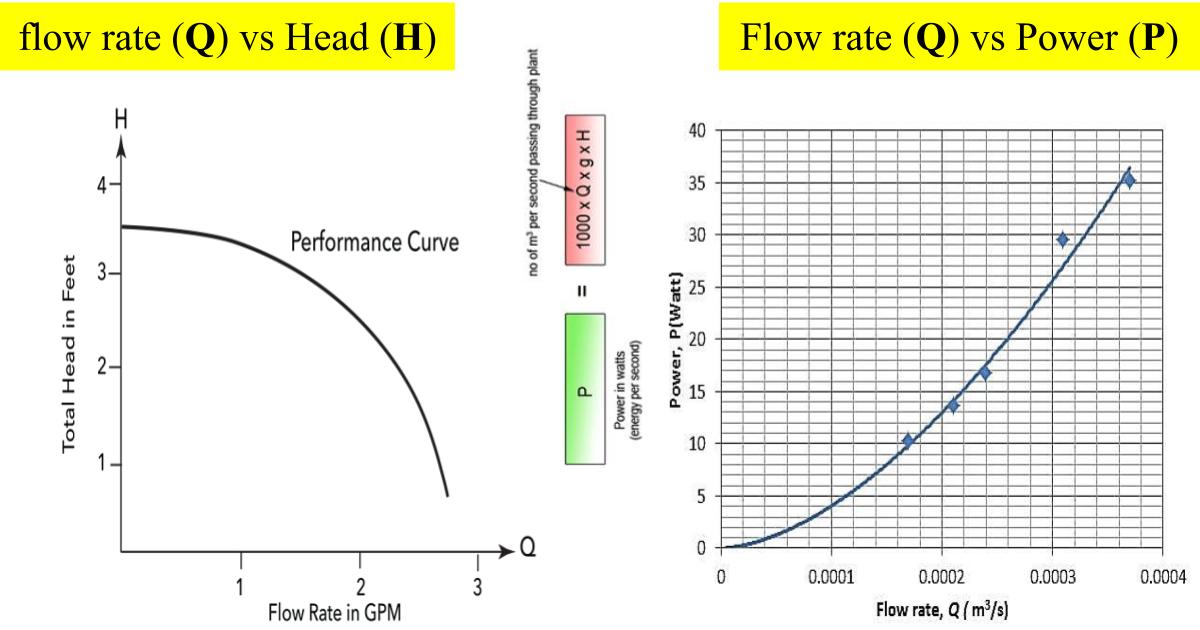
Flow rate vs head
Basically flow rate and head of a pump are inversely proportional to each other. In the above mentioned picture you can check as the head is decreasing from top X axis to Y axis and accordingly flow rate is also increasing on the Y axis. The flow rate, head, power computation and efficiency is totally dependent on the fluid properties like viscosity and density. If the pump is operated at high viscous fluid on which that is not designed for the same, then the head and flow rate will be decreased accordingly. So the final conclusion is that if you are selecting appropriate pump fluid properties, it is also an important part.
Flow rate vs power
For a centrifugal pump, flow rate and power are directly proportional to each other. In the above mentioned picture you can see if the flow rate of the pump is increasing on the Y axis, then power consumption is also on the X axis, increasing accordingly.
Power vs efficiency curve
The power and efficiency curve of centrifugal pumps are very important types of curve to identify the pump performance and both are inversely proportional to each other as you show in the figure. As the power is increased, the efficiency will decrease correspondingly so in the pump performance power consumption plays an important role.
System Head Curve
System Head curve is a curve created by incorporating the friction-head curve with the static head and any other difference of pressures in the complete pumping system. Above the head curve is combined with a total static head of 135 ft to obtain the system. System-head curve is the summation of total static head and friction head for the complete system head curve. In this figure the static head is supposed to be fixed, as it is where the suction point and discharge levels are fixed. Friction head rises with the flow. Superimposing the head-capacity curve of the pump on the system-head curve, as in Fig. illustrates the head/pressure and capacity at which the pump will function, such as line A where the two curves cross. In this system, the pump discharges 9000 GPM at a 14 meter head.
Where the fixed head or pressure fluctuates, system-head curves may be charted for lowest and highest static heads or pressures. Superimposing a centrifugal pump head-capacity curve allows anticipating the capacity that the pump will produce at various static heads.
Centrifugal pump capacity
The standard measurement unit of capacity changes with the application as well as country. For example, centrifugal pump designers’ standard is M3/H in India, and cubic meters per hour in countries using the metric system whereas in the United States gallon per minute. Generally, the following other units are used for capacity in India and other countries as well as million gallons per day or minute, cubic feet per second, cubic meters per minute, gallons per minute, barrels per day or minute, barrels per hour, pounds per hour or minute, and acre-feet per day.
What happened to the characteristic curves, when connected the pumps in series or connected the pumps in parallel.
The pumps are connected in Series
If two pumps are connected in series. The flow rate will remain the same, but the head will increase.
Combining efficiency = (Q x Combined head) / (BHP of Pump 1 and BHP of Pump 2)x102,
Then you can expect more head, rather than curiosity in the more head.
The pumps are connected in parallel
Pumps are connected in parallel, the heads are the same, Q which is going, Q 1 + Q 2 will be coming out, then the powers anyway you have to add up, and then H will be the same, same head the only the Q is going to increase by individual combined efficiency in this case. H is not changing, H*Q/ 102*BHP 1+ BHP 2 give the efficiency of the pumping system. The pump performance depends on the design and installation. power, head, discharge All these parameters and we need to understand how these are connected, a relationship among themselves.
There are some articles mentioned below which you can also read.
- What Is Plain Bearing
- Basics Of Reciprocating Pump
- What Is Centrifugal Compressor
- What Is Flexible Coupling | Types | Selection
- Characteristics Of Positive Displacement Pump
- Basic Use Of Wearing Rings In Centrifugal Pump
- Important Interview Questions About Shaft Coupling
- What Is Rigid Coupling And An Overview Of Rigid Coupling
- What Is Submersible Pump And How To Select Best A Submersible Pump

